| Projects | Publications |
Quantifying the effects of land-use and socio-economics on the generation of traffic emissions and individual exposure to air pollution at a metropolitan scale
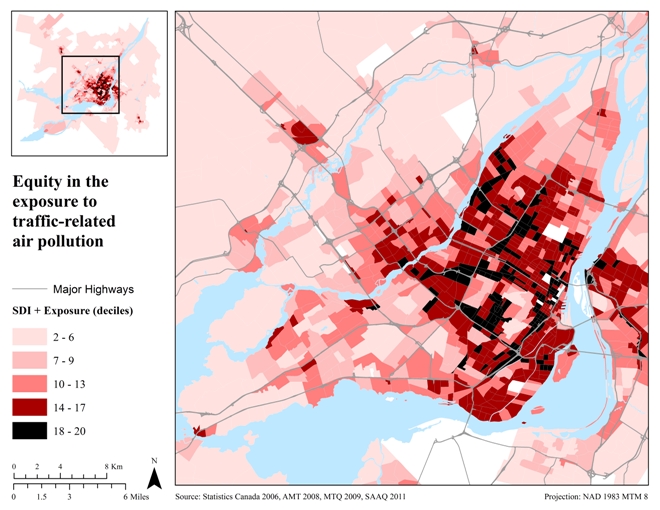
The objective of this study is to better understand the generation of traffic-related air pollution at a metropolitan scale and identify the regions that are potentially the most affected by these emissions. We propose two measures of traffic emissions that potentially capture inequity in the spatial distribution of emissions: (1) the average level of emissions generated per individual and (2) the level of emissions occurring in a zone as a proxy for air pollution exposure. These indicators are estimated at the traffic analysis zone (TAZ) level by extending a regional traffic assignment model with capabilities for individual trip emission modeling while taking into account vehicle (type, age) and trip attributes (road type, speed, volume). We examine the spatial distribution of emissions as well as capture the determinants of emissions generated and exposed to through a multivariate regression analysis of the two indicators against a set of land-use and socio-economic variables. Our study area includes the Montreal metropolitan region, which covers an area of approximately 4,200 km2 and has a population of about 3.8 million.
The spatial distribution of results across the region is shown below. As expected, the high emitting individuals tend to reside on the periphery of the region, which is furthest from the central business district (CBD). Concurrently, the majority of low emitting individuals live centrally, on the island, much closer to the CBD. Overall, these results clearly confirm the intuitive hypothesis that high polluting individuals reside away from the downtown in suburban areas.