Clean Ride Mapper
Informing cyclists on Air Quality in Montreal
Français
Guillaume Barreaua, Scott Weichenthalb, Mark Goldbergc, Marianne Hatzopouloua
a: Department of Civil Engineering, McGill University, Montreal, Quebec, Canada
b: Health Canada, Ottawa, Ontario, Canada
c: Department of Medicine, McGill University, Montreal, Quebec, Canada
Disclaimer
Clean Ride Mapper is an exploratory tool for cyclists interested in the possibility of minimizing the air pollution during their rides. It is based upon a computer algorithm and modelled traffic and air quality data. The routes proposed should therefore be understood as a best-guess effort. Users are urged to exercise judgment regarding the safety of specific suggested routes and to independently verify route information presented here. This route planning service is provided as is with no guarantee of any kind.
Back to the application
Data sources
Road network
The data describing the road network that is used to compute routes was obtained from the
City of Montreal Open Data Portal.
Nitrogen dioxide (NO2) Concentrations
We are indebted to Mark Goldberg from the department of medicine at McGill University for giving us access to the dataset whose collection was described in this article.
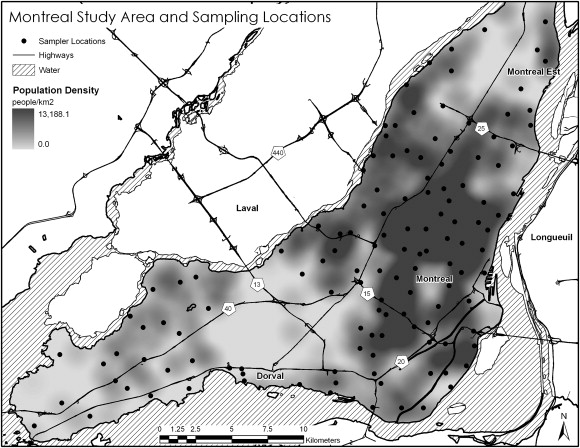
NO2 concentrations at 133 locations in Montreal (shown on the map to the left) were measured with passive diffusion samplers in December 2005, May 2006 and August 2006. A number of variables such as land-use, population density, ... were collected and a regression model was calibrated to correlate the measured NO2 concentrations with the other variables. This land-use regression model was then used to predict the yearly average of NO2 concentration everywhere on the Montreal island.
The result is a raster dataset (over a regular grid of square pixels 5 meters each side) with values ranging from 4.26 ppb (parts per billion) to 37.34 ppb. This raster data can be visualized by ticking the NO2 box in the application; red represents high concentrations and green represents low ones.
Traffic volumes
Average daily traffic volumes are the results of a traffic assignment model maintained by the TrAQ research group. With input from the Origin Destination survey conducted in 2008 by the Agence Metropolitaine de Transport (AMT), the software predicts traffic flows on every road segment on the Montreal island.
Known limitations of the data
Road network
The underlying road network provided by the city is accurate but it is a car-oriented network. As a result, some paths dedicated to bicycles are not represented on this network and are therefore unavailable to the route planner.
NO2 concentrations
The NO2 rasterized data used here is the result of a statistical estimation. Furthermore, the prediction is of a yearly average calculated from measurements made in 2005-2006.
Traffic data
Traffic volumes are the result of a simulation. The model is unable to predict traffic levels below a certain threshold. As a result, traffic volumes on minor roads may be underestimated.
Route-planning algorithms
Calculation of the 3 routes is done with the Network Analyst module of ArcMap. Network Analyst uses the Dijkstra algorithm to solve this problem. For the cleanest and quietest routes, the cost associated with each elementary segment of the network is respectively the cumulative NO2 exposure along the segment and the expected number of vehicles encountered on the segment.
The quietest and cleanest routes suggested by Clean Ride Mapper are sometimes very different from each other. This divergence is explained by the fact that near-road NO2 levels are not perfectly correlated with traffic on the same road. As a matter of fact, NO2 levels are influenced by urban and regional sources. These two routes optimized for traffic and for NO2 illustrate to the user how minimizing exposure to traffic does not necessarily lead to the minimum NO2 exposure.
Application Architecture
The back-end of this application is an ArcGis server with the network analyst described above running as a web service. The front-end uses javascript libraries to combine the ArcGis server data about the routes with maps coming from Google.
Back to the application