Ultrafine Particles (UFPs) generally refer to particles with aerodynamic diameter less than 100 nanometers. Ambient UFP data (in particles per cm3) was collected during a mobile monitoring campaign conducted in Toronto for two weeks in September 2010 and one week in March 2011. Each day three separate vehicles equipped with roof-top monitoring devices monitored real-time ambient UFPs at 1-second resolution. Each vehicle collected UFP data for six hours per day: once in the morning (7:00-10:00) and once in the afternoon (15:00-18:00). All samples were collected on weekdays.
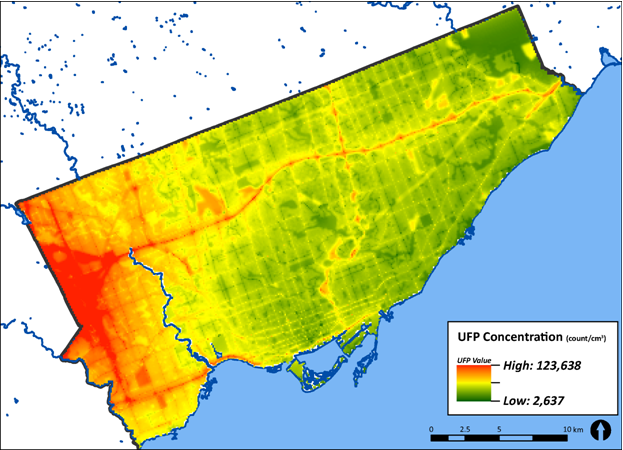
A number of variables such as land-use, population density and building footprint were collected on a grid of 100 x 100 meter cells and a regression model was calibrated to correlate the measured UFP concentrations with the other variables. This land-use regression model was then used to predict the UFP concentration on each grid cell in the City of Toronto.
The result is a raster dataset with values ranging from 2,637 ppcm3 (particles per cm3) to 123,638 ppcm3. This raster data is shown below but it can also be visualized by ticking the UFP box in the application.
All details are available in the publication: Characterizing the spatial distribution of ambient ultrafine particles in Toronto, Canada: A land use regression model.
Calculation of the 2 routes is done with the Network Analyst module of ArcMap. Network Analyst uses the Dijkstra algorithm to solve this problem. For the cleanest route, the cost associated with each elementary segment of the network is the cumulative UFP exposure along the segment.
The back-end of this application is an ArcGis server with the network analyst described above running as a web service. The front-end uses javascript libraries to combine the ArcGis server data about the routes with maps coming from Google.
Back to the application